Visualization#
Visualizing data is always helpful to help understand problems and opportunities. This is why pacsanini comes equipped with a dashboard to help users understand the data they have collected.
Info
To use the dashboard, you must have configured your backend metadata storage resource to be a database. The dashboard will not work with CSV files as their data input source.
To start the dashboard, run the following command:
pacsanini dashboard -f pacsaninirc.yaml
This will spawn a server instance listening on port 8050. To change the port,
simply add the -p <PORT> option to the command.
You can then visit your browser by going to http://localhost:8050. Below is an image of what to expect from the dashboard.
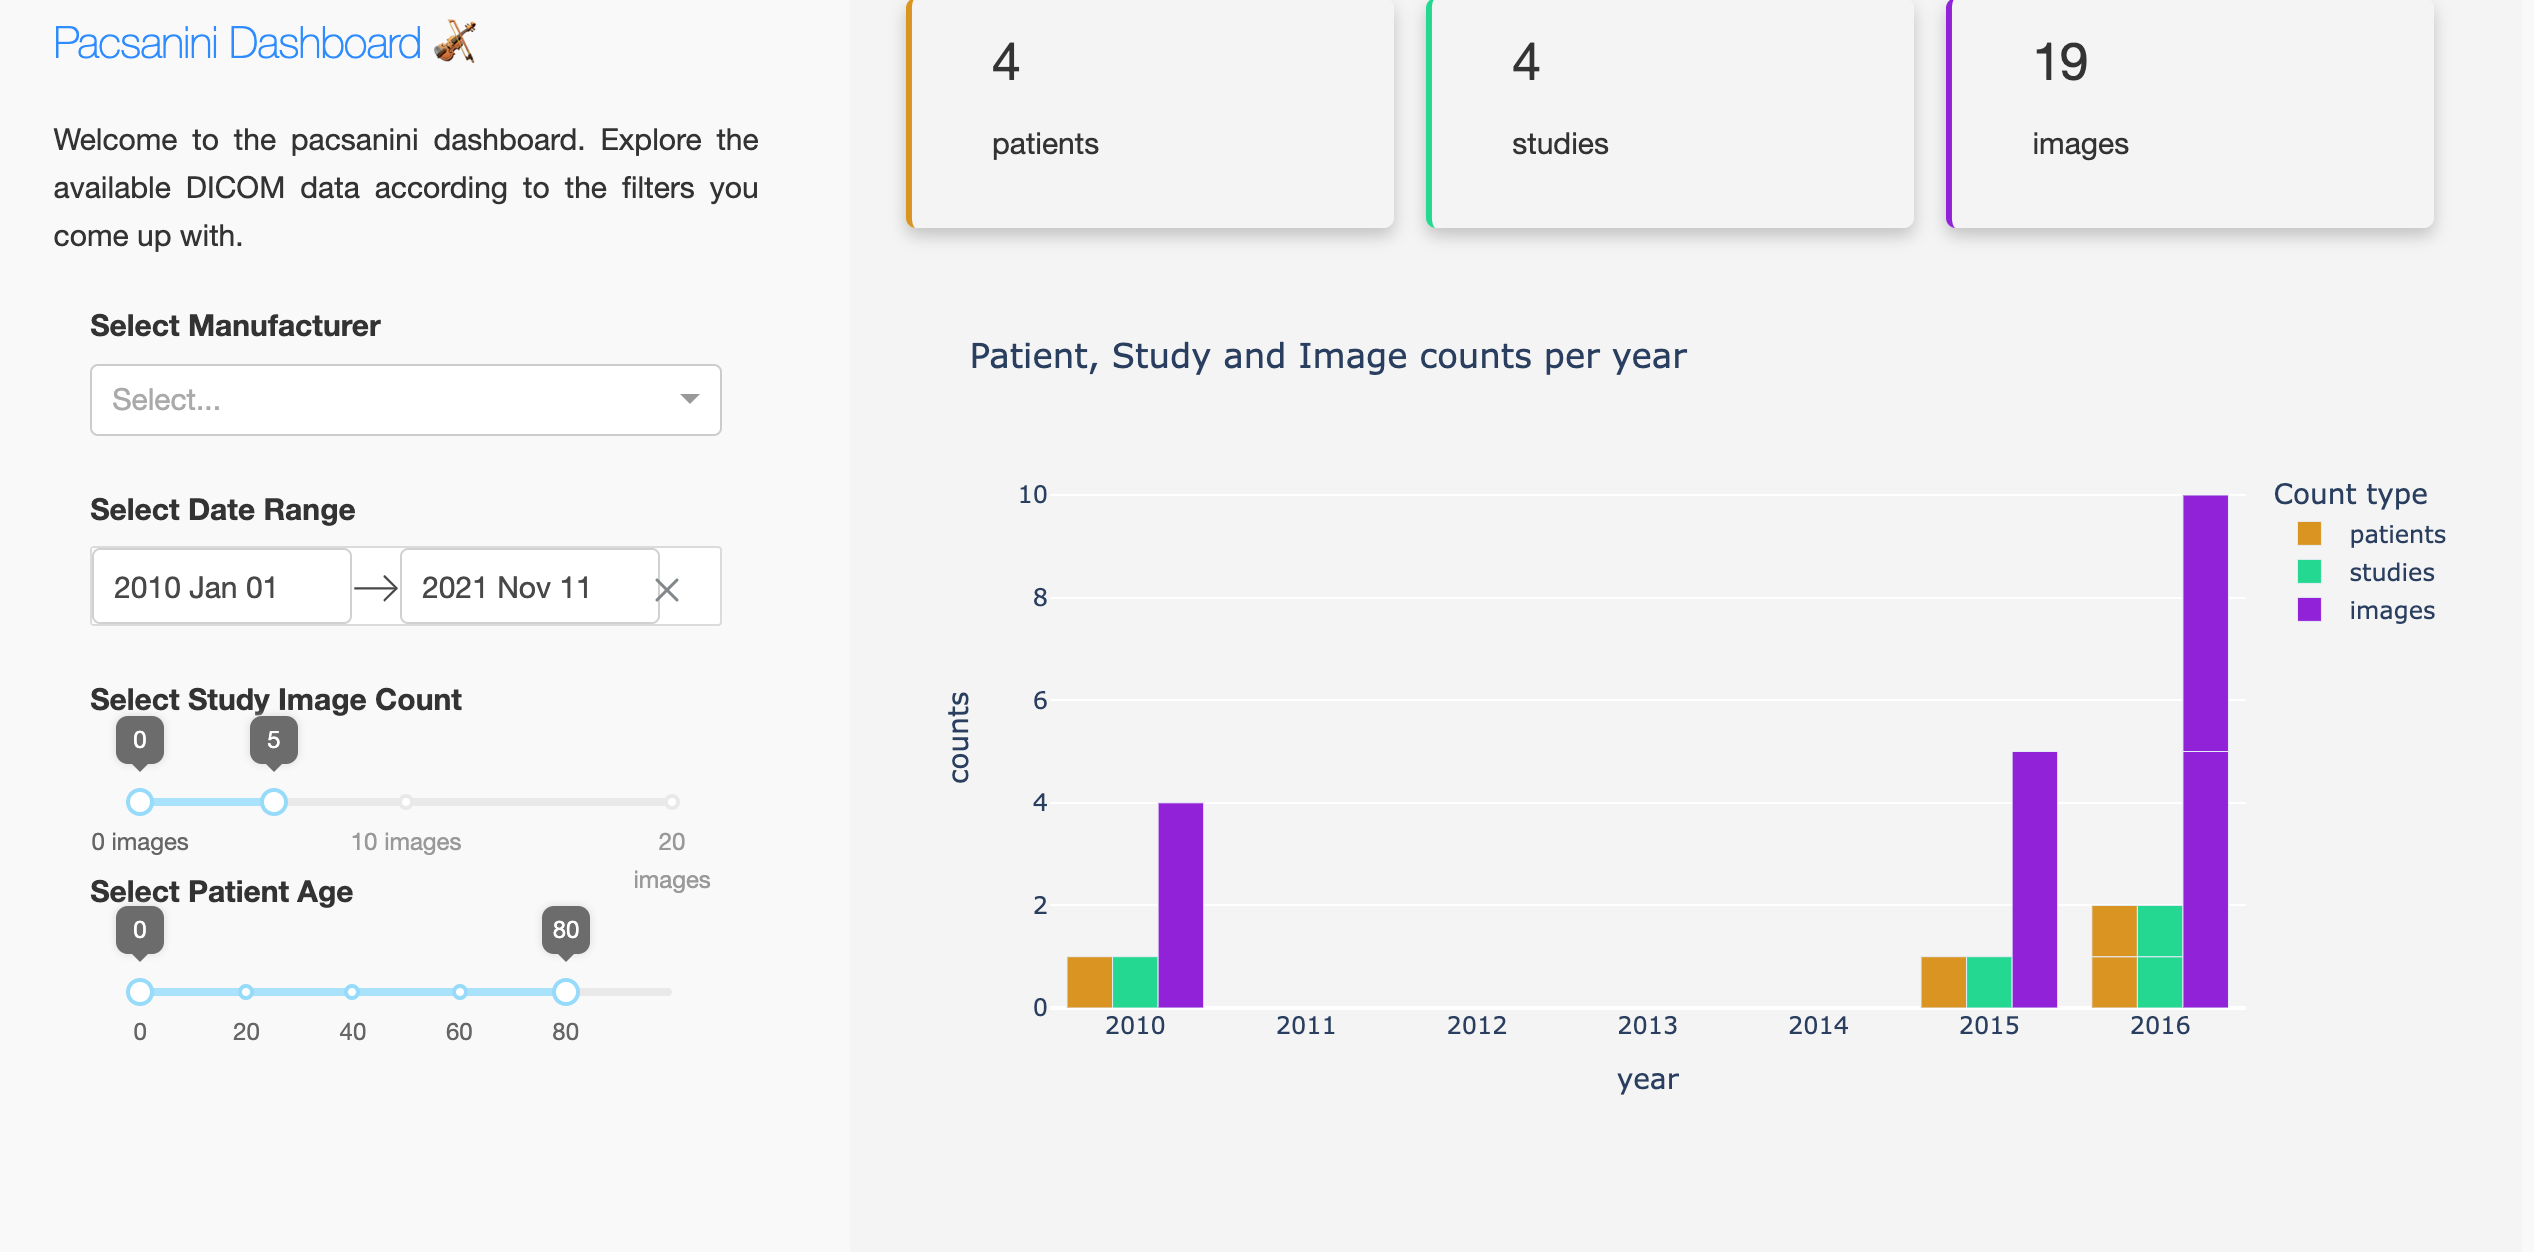
The dashboard enables you to query your data backend according to the following criteria: * manufacturer: you can select zero or more manufacturer names to filter on * date range: you can select a specific date range to filter data * study image count: you can select studies with a specific amount of images within them or with a certain range of images * patient age: you can select only patients within a certain age range